
Equatorial: climate and agricultural accessibility
Work in progress
Equatorial combines transport, climate and agriculture datasets to study accessibility across the equatorial belt. The Python workflow supports data acquisition, vector and raster processing, database-backed road-network analysis and reproducible research figures.
The figures below show crop-cluster origins, weekly precipitation scenarios and modelled changes in travel time to destinations.
Research figures
Click any figure to open the original image at full resolution.
Study area and input coverage
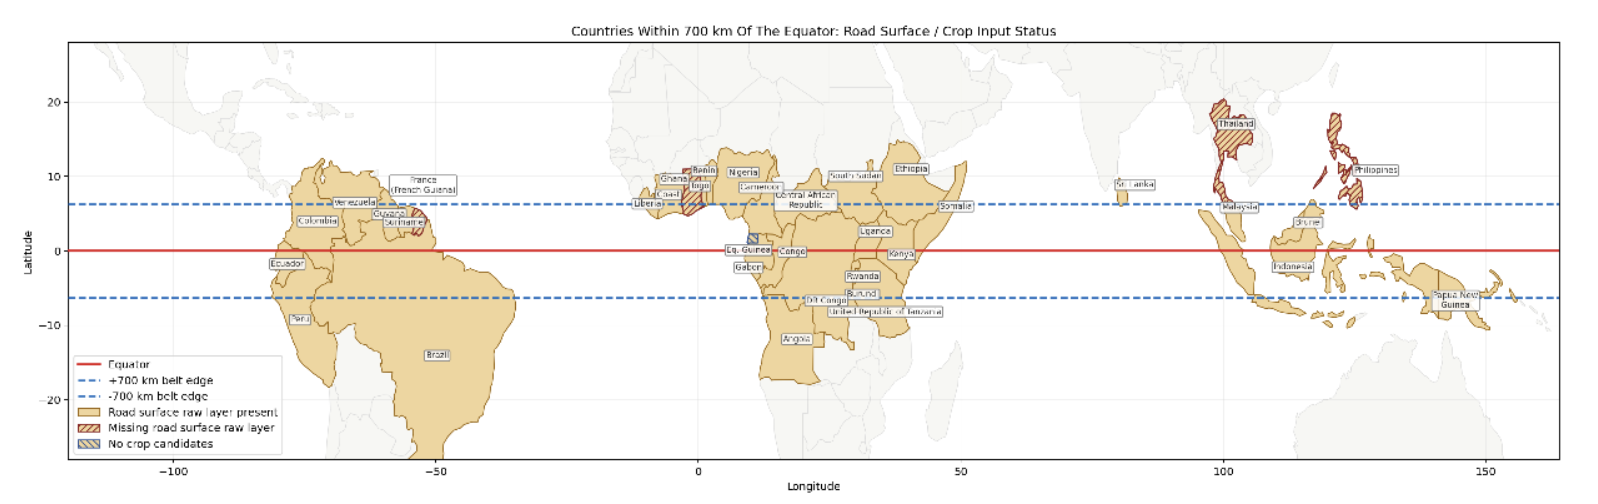
Countries intersecting the 700 km equatorial belt, with road-surface and crop-input coverage.
Crop clusters and road-network origins
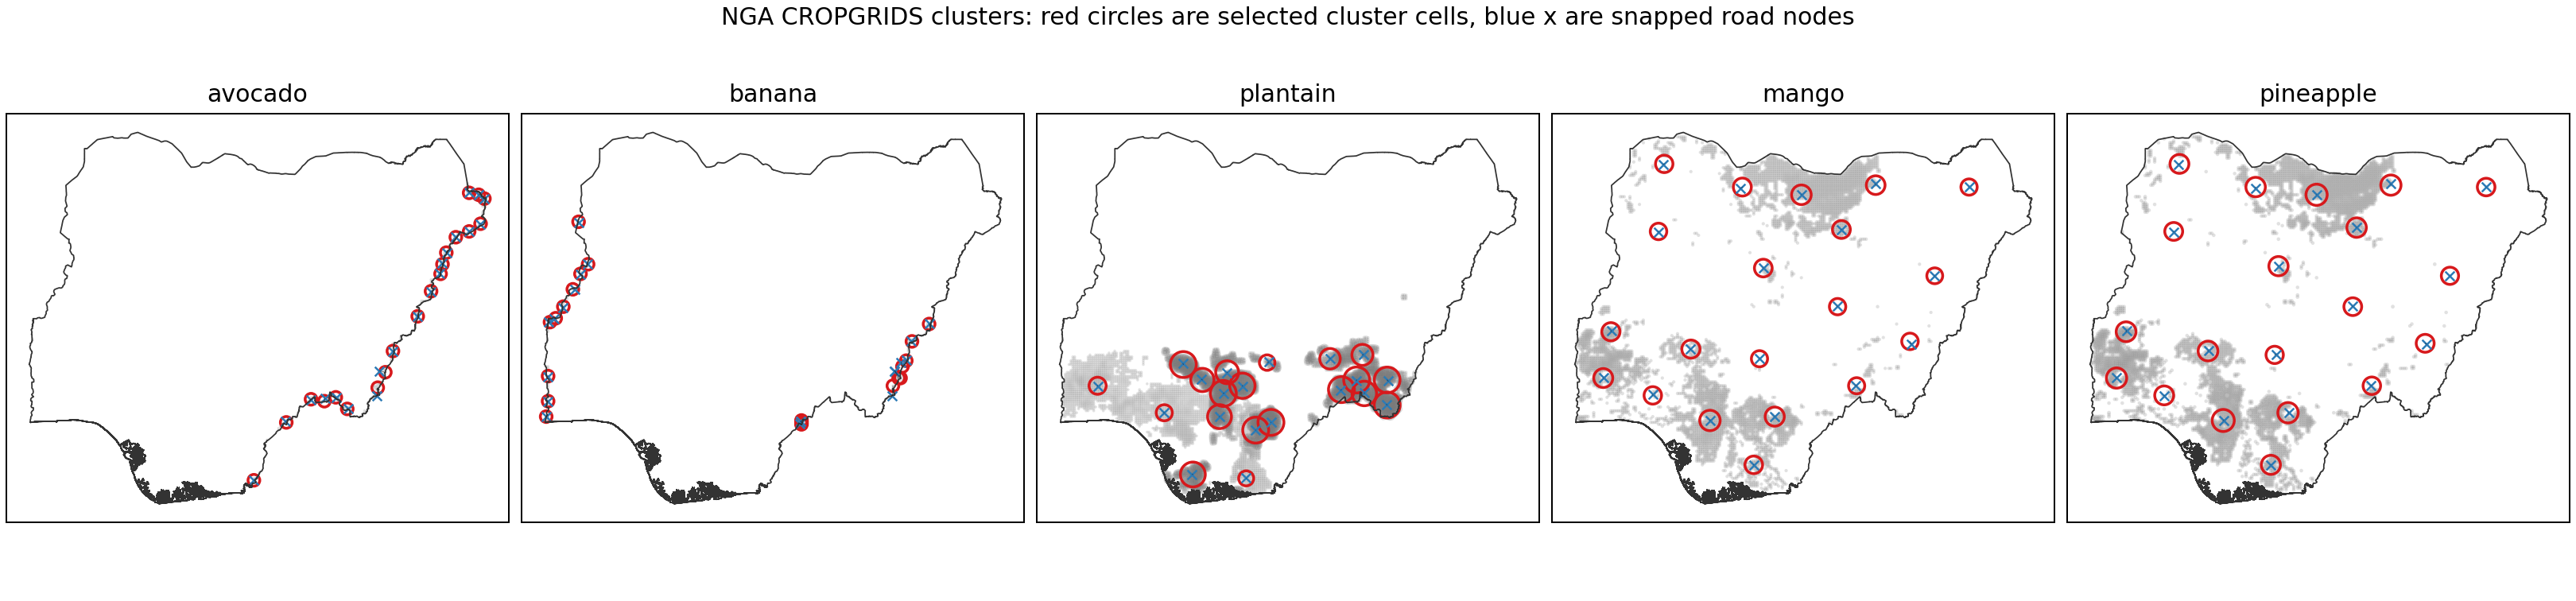
Nigeria: CROPGRIDS crop clusters, selected cluster cells (red circles) and snapped road nodes (blue crosses).
Weekly precipitation scenarios
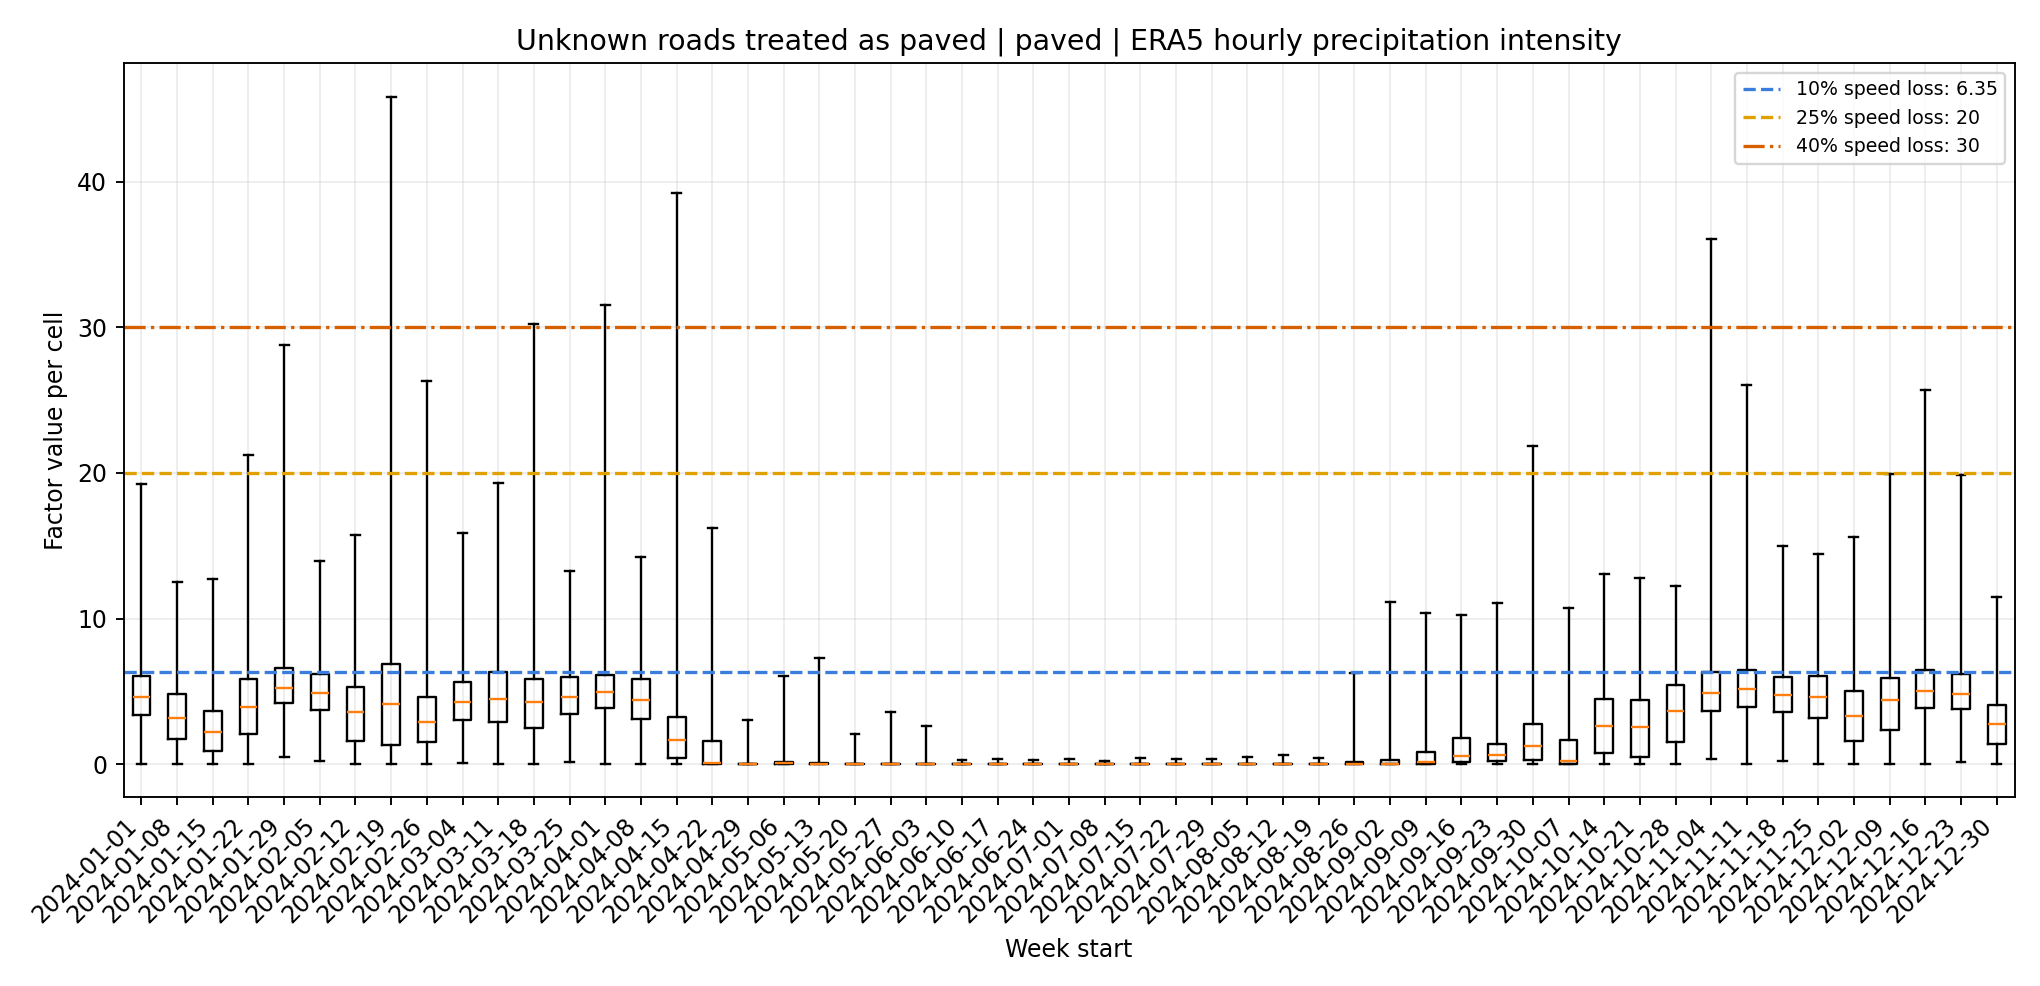
Angola: weekly distributions of ERA5 hourly precipitation intensity for paved roads, with unknown road surfaces treated as paved. Dashed lines show the scenario thresholds for speed reductions.
Weekly accessibility disruption
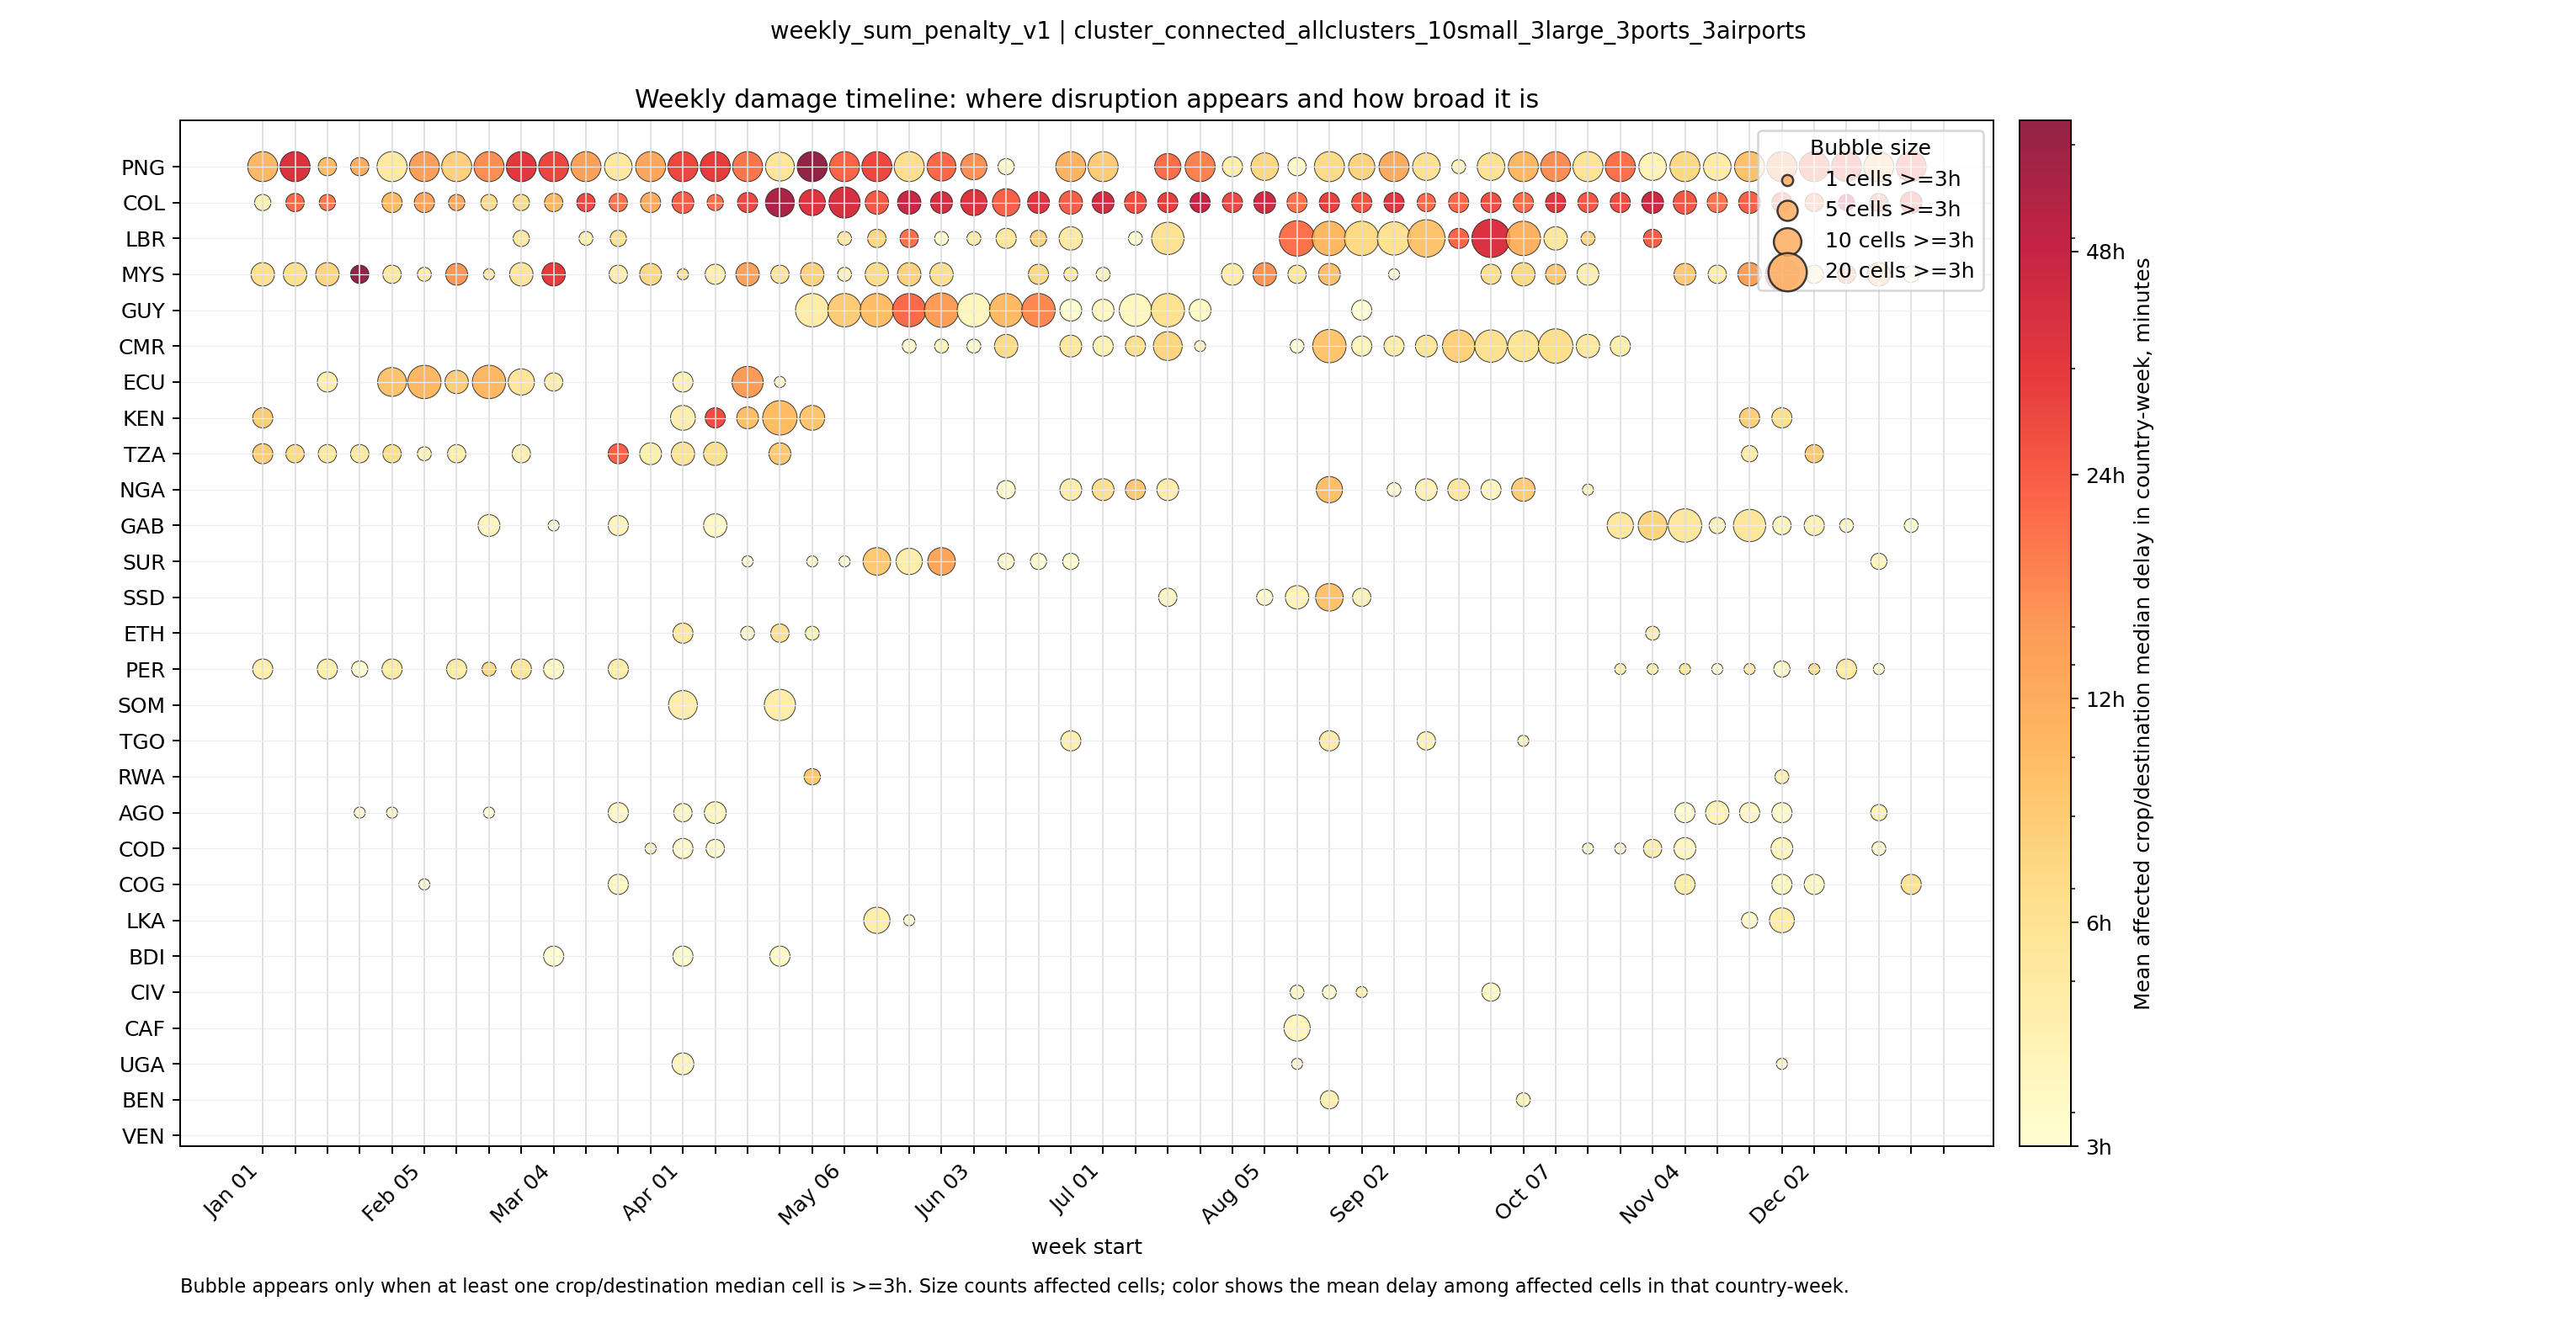
Country-level timeline of modelled accessibility delays. Bubble size counts crop/destination cells with a median delay of at least three hours; colour shows the mean delay among affected cells.
Rainfall and accessibility delay
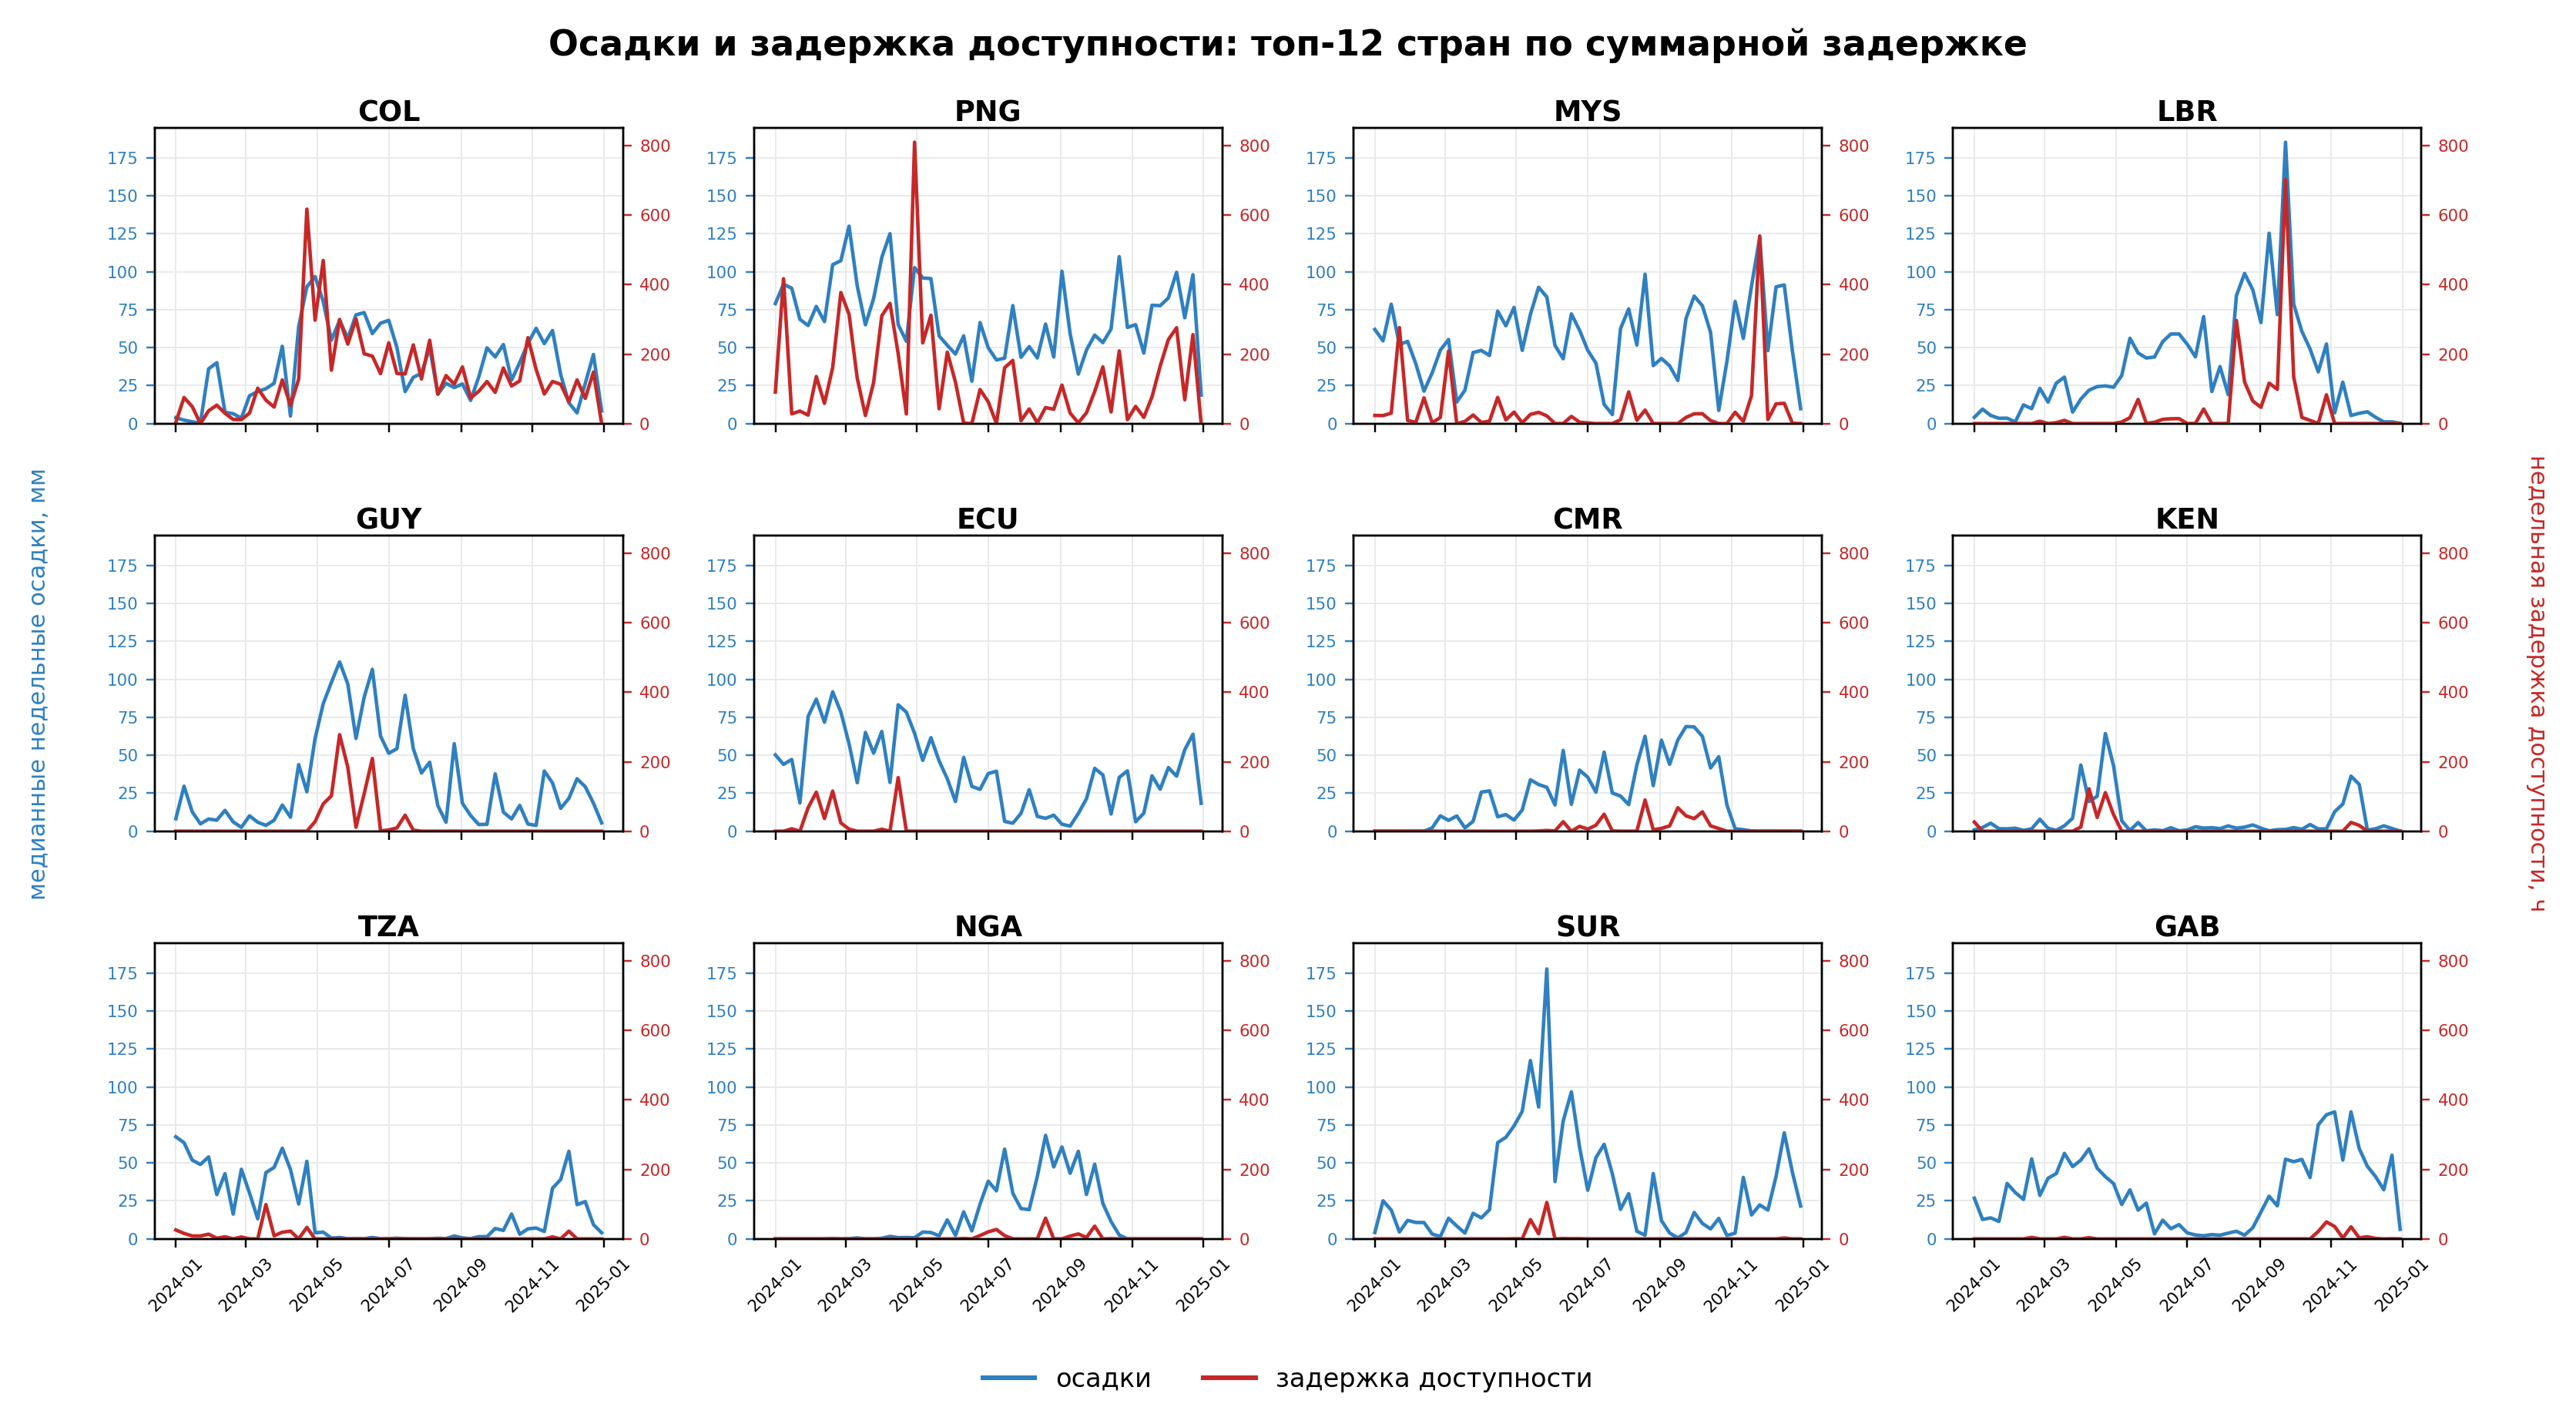
Weekly rainfall and modelled accessibility delays for the twelve countries with the greatest total delay. Original figure labels are in Russian.
Crop-level associations
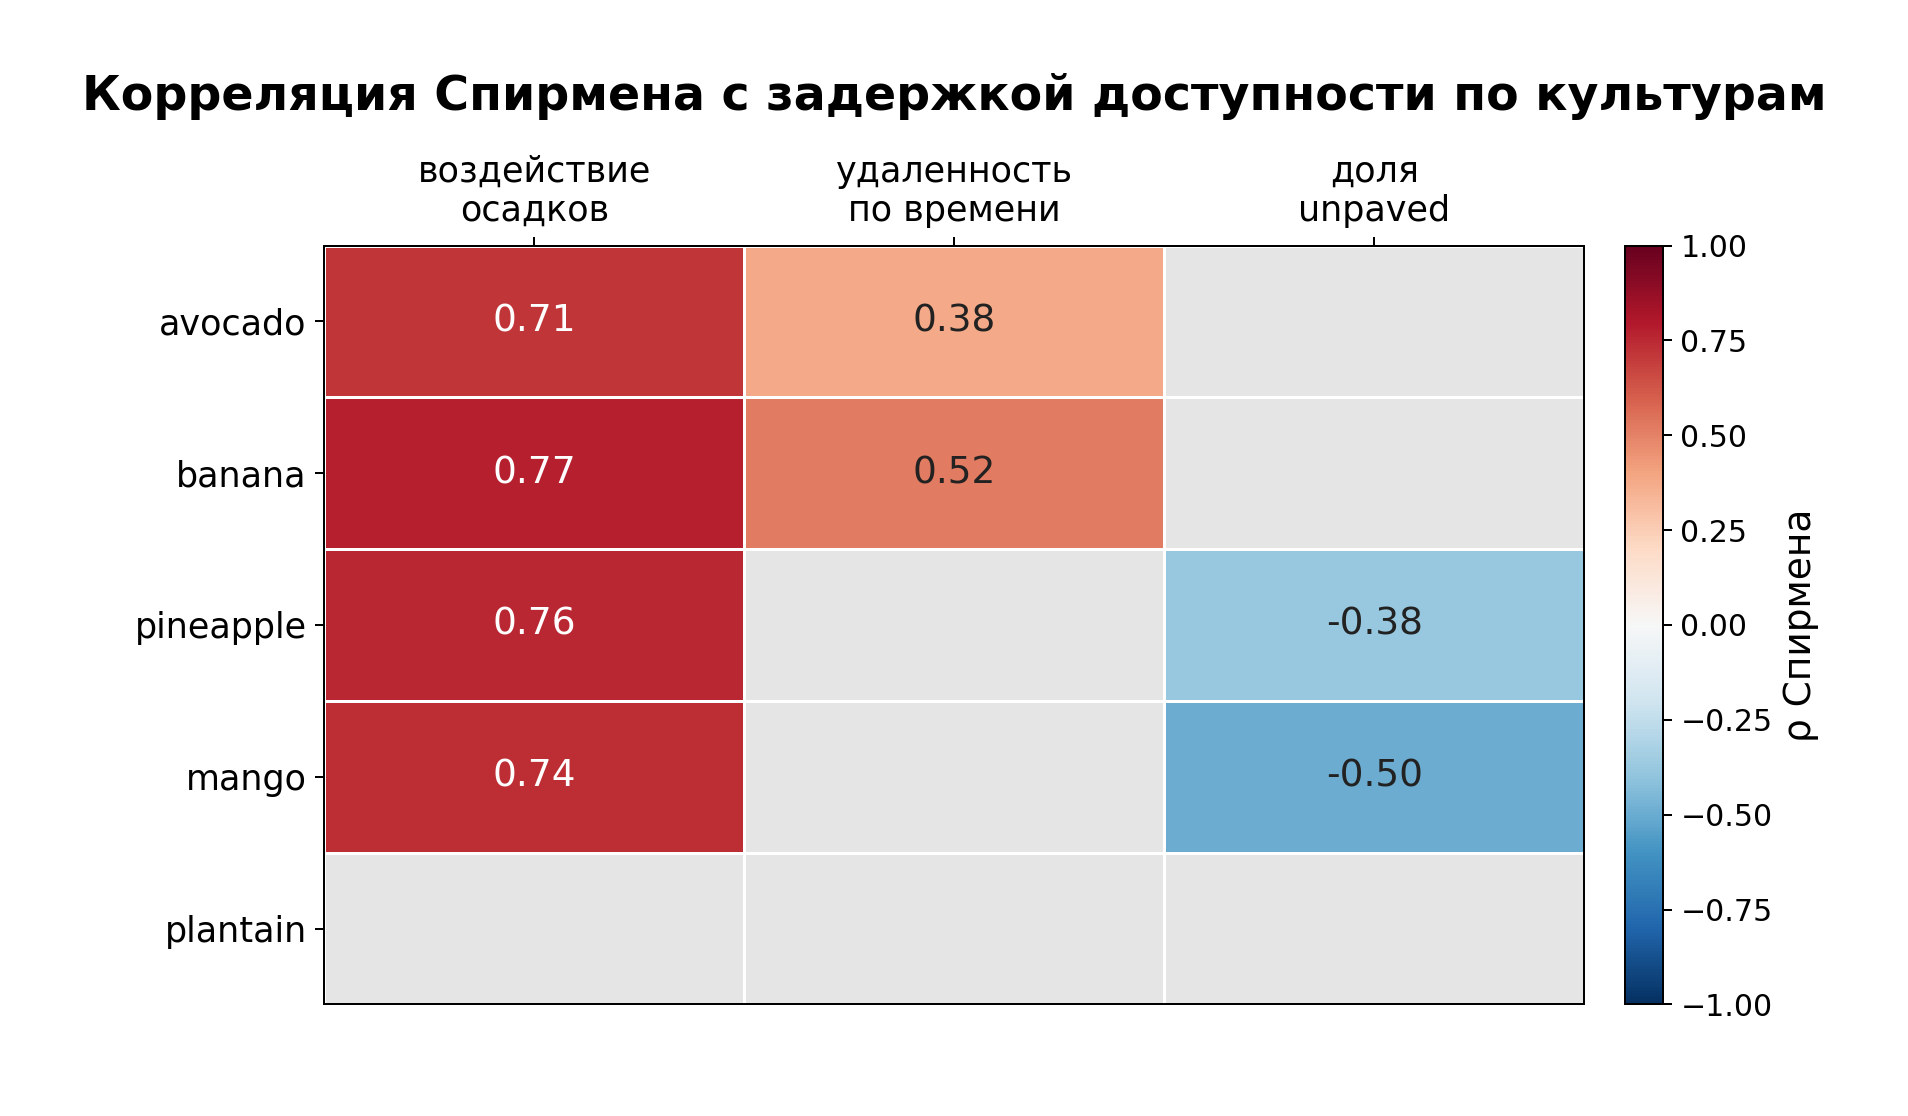
Spearman correlations between accessibility delay and rainfall exposure, travel-time remoteness and the unpaved-road share, by crop. Original figure labels are in Russian.
Liberia: access to small and large cities
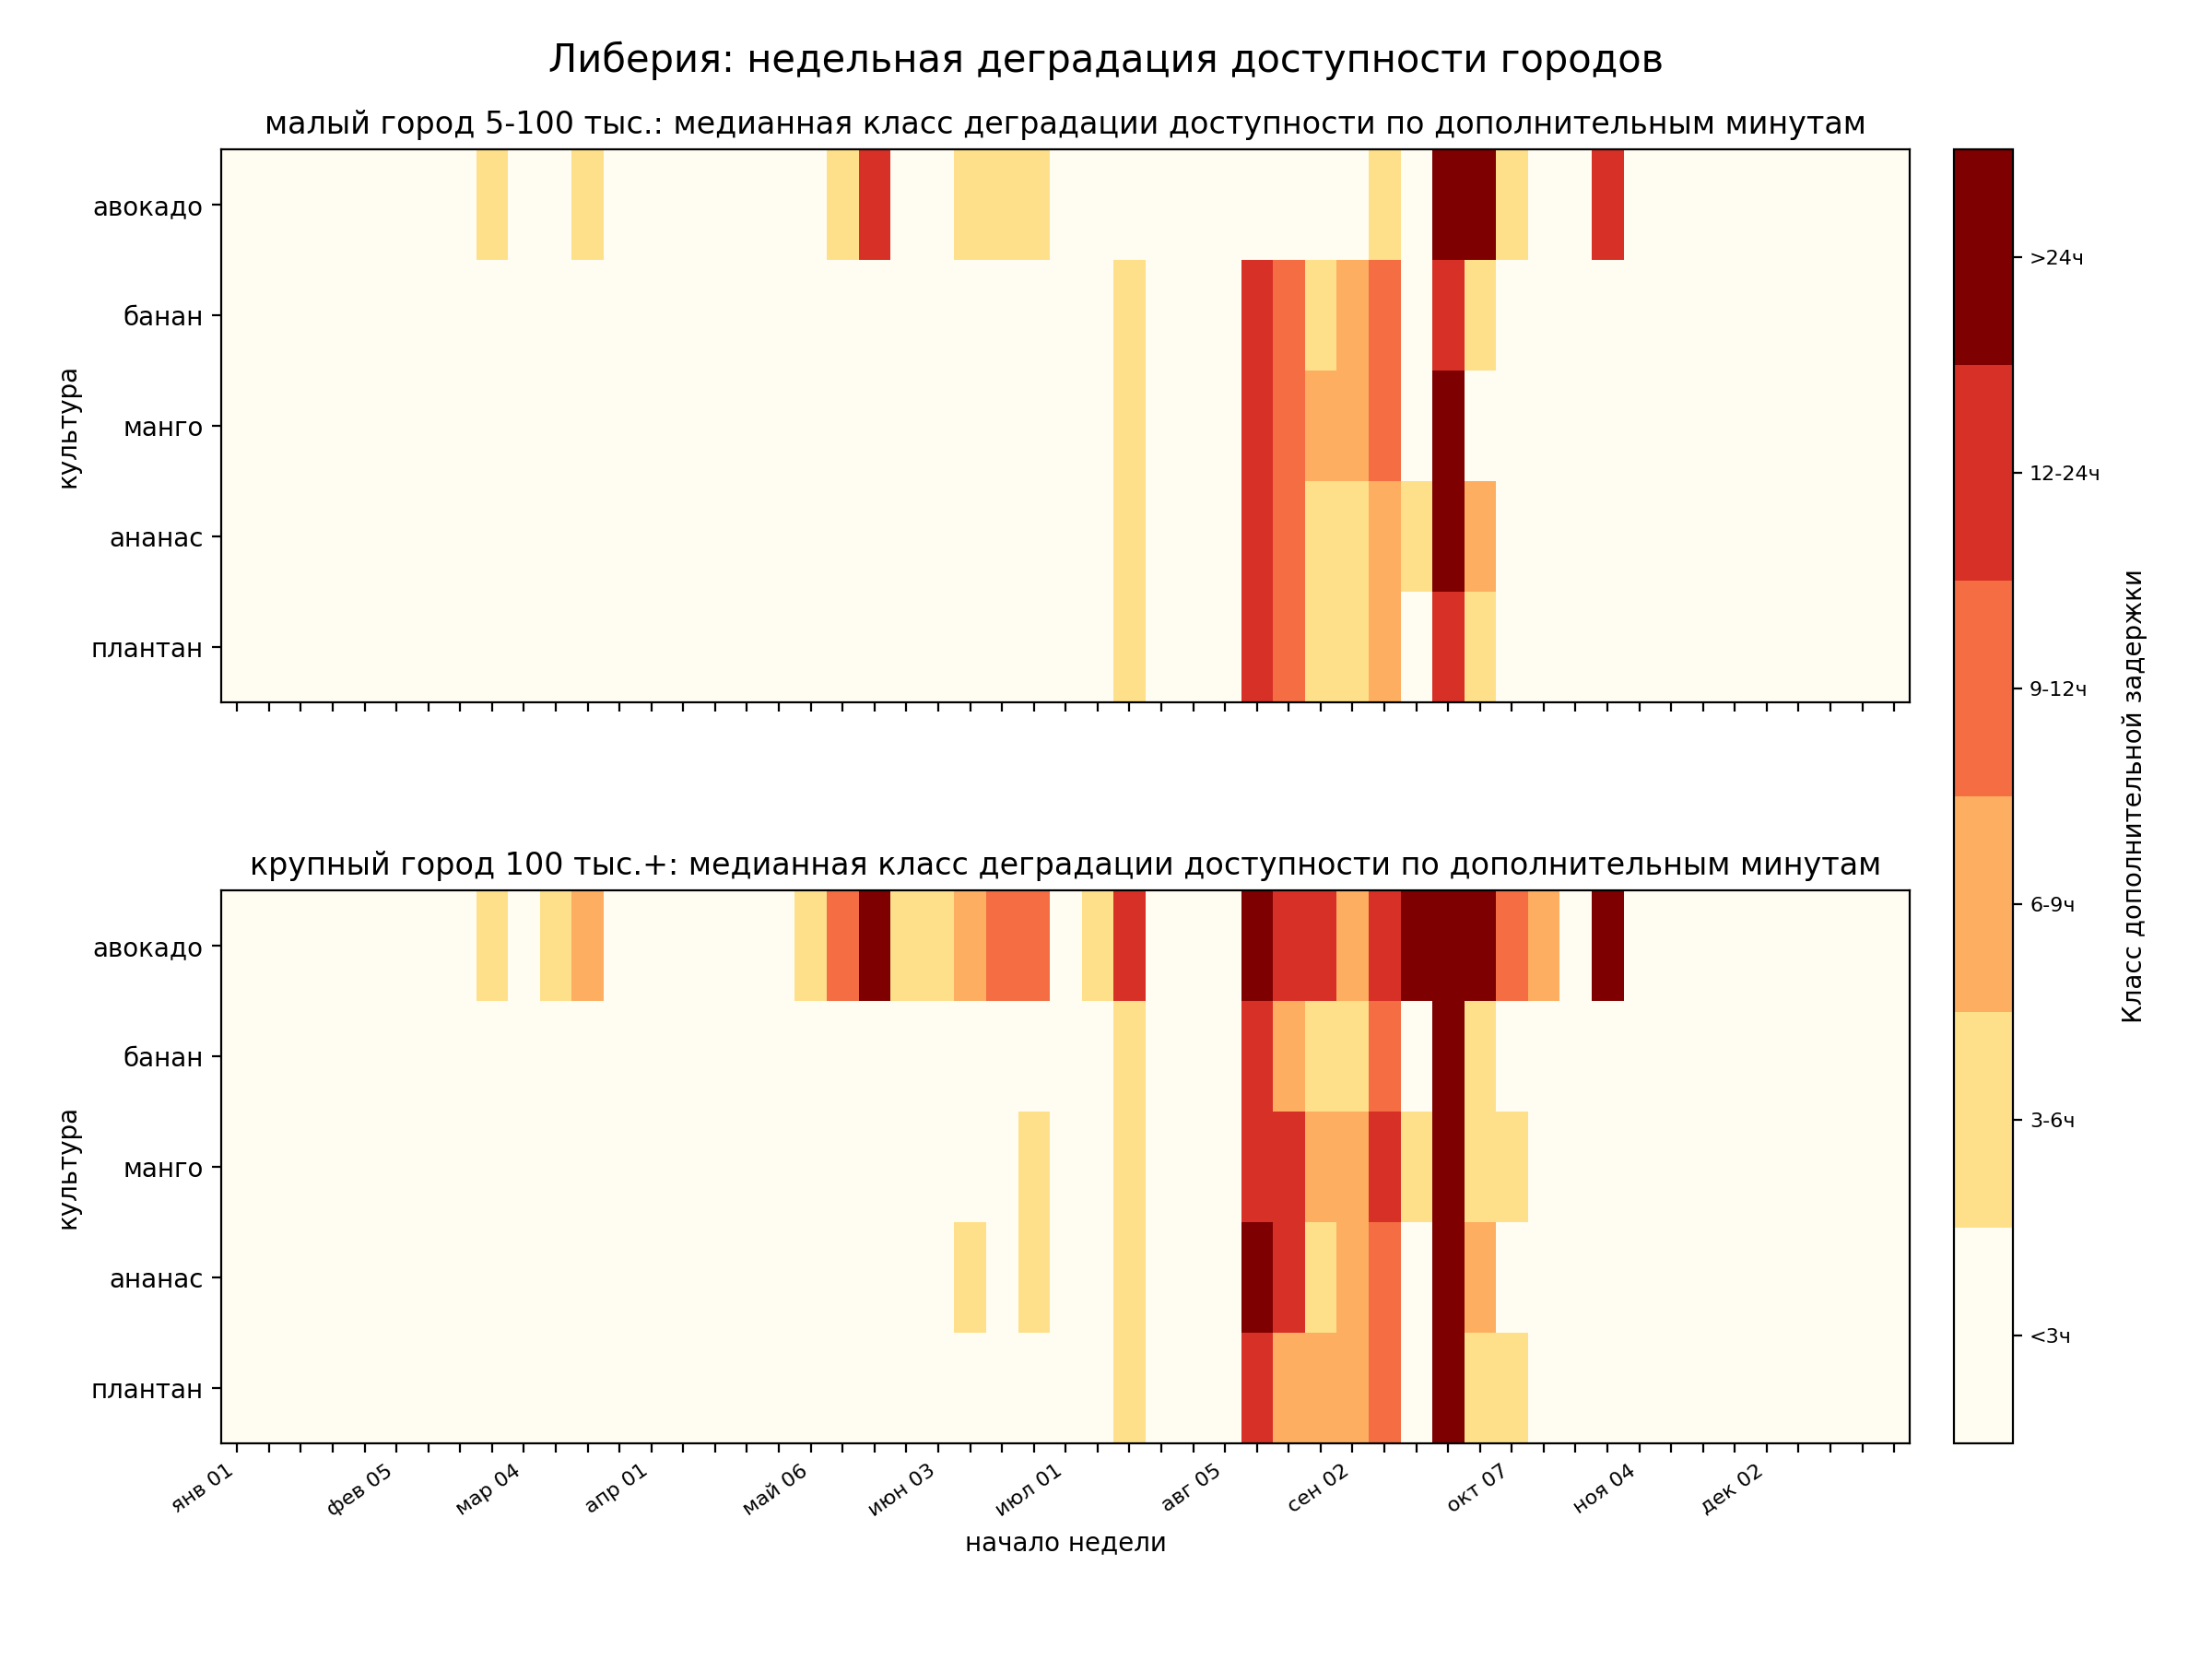
Weekly additional travel-time classes by crop for small cities (5,000–100,000 residents) and large cities (100,000+ residents). Original figure labels are in Russian.